A follow up to our article, What's Information Design? And Why Should You Care? This…

Infographics and Digital Devices
Below are a few statistics regarding how information is retrieved and through which devices. With the growth in mobile technology, new user-friendly apps engage viewers and support marketing approaches to fit a growing digital community. These statistics are impacting how we market to consumers and on which devices. Continued research could one day make you think more seriously about mobile marketing.

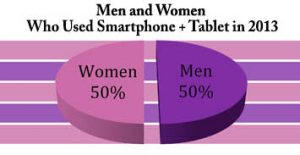
An equal split of mobile usage between men and women using smartphones and tablets.
• • • • • • • • • • • • • • • • • • • • • • • • • • • • • • • • • • • • • • • • • • • • • • • • • • •

The convenience of mobile technology keeps us connected and informed.
• • • • • • • • • • • • • • • • • • • • • • • • • • • • • • • • • • • • • • • • • • • • • • • • • • •

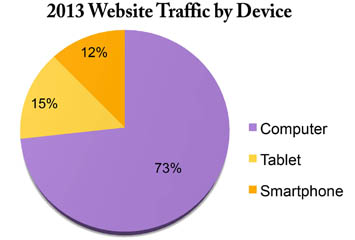
In 2012 Website traffic stats placed tablets at 9% and smartphones at 8% compared to 2013. Computers still account for a majority of website traffic today. This changes yearly.
• • • • • • • • • • • • • • • • • • • • • • • • • • • • • • • • • • • • • • • • • • • • • • • • • • •

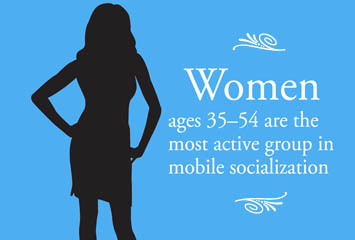
Women ages 35-54 are regularly participating and adapting to mobile technology to stay connected.
• • • • • • • • • • • • • • • • • • • • • • • • • • • • • • • • • • • • • • • • • • • • • • • • • • •

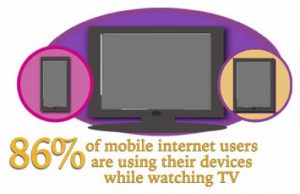
Using mobile devices has become increasingly popular as users shift their attention among different electronics.
These are just a few statistics but clearly mobile media is becoming the go-to resource by which we connect and communicate regularly. How will you market in the mobile environment?


